Weather
The Malham Webcam weather station is situated quite close to Malham Beck (the stream running through the village) and is near to some trees. This is not an ideal location, and the data produced is affected by this location.
The weather sensors are not calibrated and readings may drift slightly over time. The overnight temperature readings are moderated by warmth from the stream and often read higher than would be expected. The humidity sensor is frequently "stuck" at 100% and is often unreliable. The light sensor is not measuring the overhead light, but the light levels on the solar panels that power the weather station (it may read lower if it hasn't been cleaned for a while).
The data is provided "as is" with no warranty for its accuracy or validity.
Last month
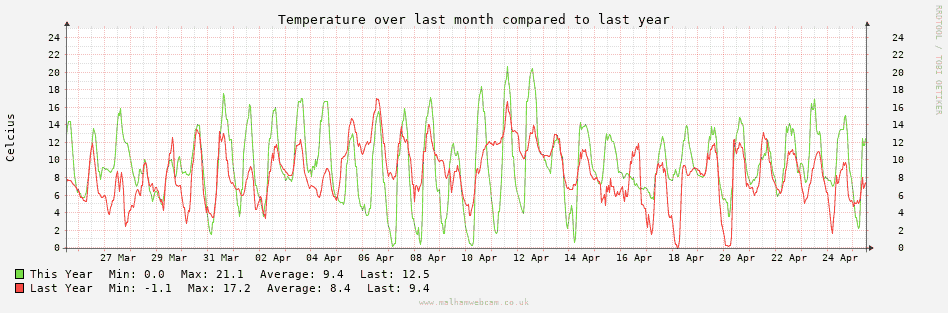
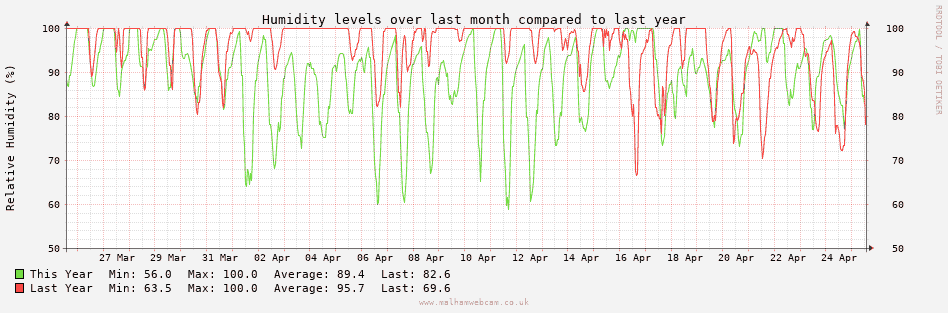
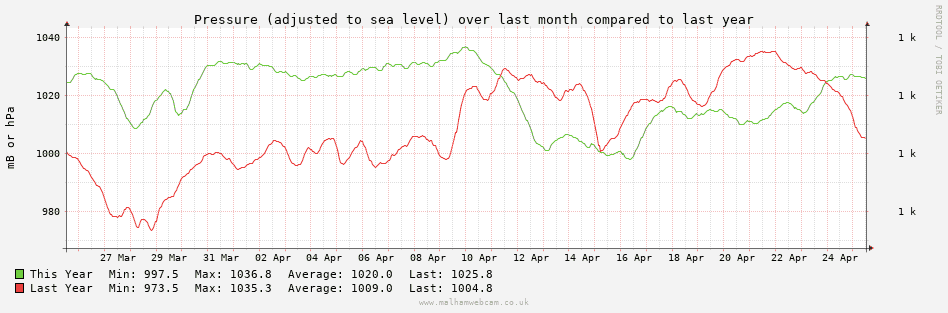
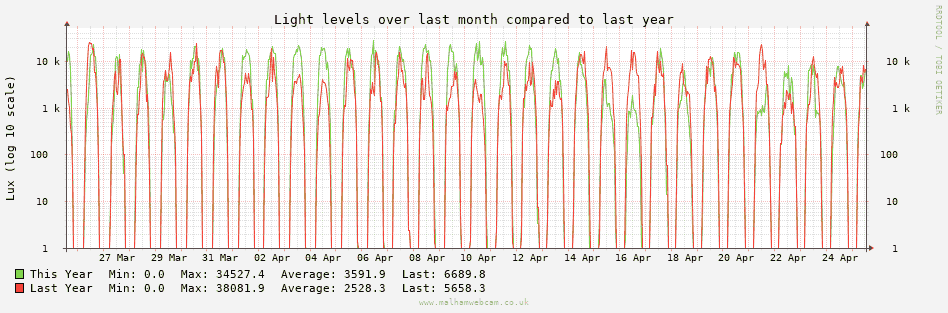
The following graphs show the weather information over the last month compared with the same time last year.
Monthly Average, Minimum, Maximum
Temperature (°C)
Values in bold are the minimum or maximum for that month over the years.
Note: This uses data from two different thermometers, the source changes at the start of 2018.
| Year | Stat | Jan | Feb | Mar | Apr | May | Jun | Jul | Aug | Sep | Oct | Nov | Dec | Whole Year |
|---|---|---|---|---|---|---|---|---|---|---|---|---|---|---|
| 2016 | Average | 5.4 | 11.2 | 13.6 | 14.1 | 14.0 | 13.4 | 9.1 | 3.7 | 5.3 | ||||
| Minimum | -2.9 | -0.1 | 3.8 | 6.1 | 6.2 | 5.6 | 3.2 | -4.5 | -4.4 | |||||
| Maximum | 19.8 | 22.7 | 23.2 | 25.3 | 21.2 | 21.4 | 14.9 | 13.0 | 11.6 | |||||
| 2017 | Average | 3.2 | 4.9 | 6.6 | 7.3 | 11.3 | 13.3 | 13.5 | 13.4 | 11.6 | 10.8 | 5.5 | 3.4 | 8.8 |
| Minimum | -4.0 | -1.6 | -1.3 | -1.2 | 1.2 | 6.8 | 8.0 | 6.4 | 1.6 | -1.2 | -2.6 | -6.7 | -6.7 | |
| Maximum | 9.2 | 12.8 | 13.7 | 16.8 | 23.3 | 22.7 | 21.1 | 20.9 | 20.5 | 18.0 | 12.8 | 10.7 | 23.3 | |
| 2018 | Average | 4.4 | 2.6 | 4.1 | 8.8 | 13.3 | 15.7 | 17.7 | 15.0 | 12.2 | 9.8 | 7.5 | 6.1 | 9.8 |
| Minimum | -1.9 | -5.6 | -5.1 | 0.4 | 0.9 | 6.0 | 7.9 | 5.1 | 1.7 | 0.1 | 0.1 | -1.9 | -5.6 | |
| Maximum | 11.0 | 11.8 | 13.0 | 23.9 | 24.8 | 26.9 | 27.5 | 23.6 | 22.8 | 21.1 | 14.1 | 11.8 | 27.5 | |
| 2019 | Average | 3.8 | 6.3 | 6.7 | 9.2 | 10.7 | 13.4 | 16.8 | 15.6 | 12.7 | 8.8 | 5.9 | 5.3 | 9.6 |
| Minimum | -7.0 | -6.5 | 0.0 | -2.2 | 1.6 | 5.2 | 6.3 | 7.4 | 3.6 | 0.2 | -2.9 | -3.1 | -7.0 | |
| Maximum | 10.6 | 18.8 | 14.8 | 24.4 | 20.5 | 25.9 | 30.6 | 27.1 | 22.9 | 14.9 | 12.5 | 11.1 | 30.6 | |
| 2020 | Average | 6.2 | 5.3 | 6.3 | 9.9 | 11.8 | 14.6 | 14.0 | 15.8 | 12.5 | 9.5 | 8.1 | 4.7 | 9.9 |
| Minimum | -2.6 | -1.5 | -2.5 | -1.9 | -1.5 | 5.4 | 5.5 | 5.1 | 1.8 | 3.3 | -1.5 | -4.4 | -4.4 | |
| Maximum | 12.4 | 10.9 | 19.1 | 20.9 | 23.9 | 28.0 | 29.1 | 29.1 | 25.4 | 16.0 | 14.8 | 12.4 | 29.1 | |
| 2021 | Average | 2.8 | 4.5 | 7.0 | 6.8 | 9.6 | 15.1 | 17.1 | 14.9 | 14.7 | 10.8 | 7.3 | 5.4 | 9.7 |
| Minimum | -5.0 | -3.3 | -1.9 | -4.2 | -1.0 | 5.1 | 8.2 | 5.9 | 5.6 | 2.9 | -5.3 | -1.2 | -5.3 | |
| Maximum | 9.6 | 12.7 | 20.0 | 20.2 | 21.5 | 23.6 | 28.1 | 22.0 | 26.6 | 17.7 | 13.0 | 12.6 | 28.1 | |
| 2022 | Average | 4.8 | 5.9 | 7.3 | 8.7 | 11.8 | 13.9 | 16.4 | 16.7 | 12.8 | 11.2 | 8.1 | 3.2 | 10.1 |
| Minimum | -3.8 | -2.7 | -2.0 | -1.8 | 4.7 | 5.4 | 8.0 | 7.9 | 2.7 | 2.1 | -1.6 | -7.2 | -7.2 | |
| Maximum | 12.9 | 12.0 | 19.5 | 19.9 | 19.9 | 24.0 | 33.9 | 27.6 | 22.3 | 15.7 | 15.0 | 11.7 | 33.9 | |
| 2023 | Average | 4.9 | 6.1 | 6.0 | 8.4 | 12.5 | 16.3 | 14.9 | 15.2 | 15.1 | 10.6 | 6.6 | 6.2 | 10.3 |
| Minimum | -5.5 | -2.8 | -6.6 | -1.2 | 3.0 | 3.5 | 8.5 | 8.5 | 6.0 | 0.2 | -4.1 | -6.1 | -6.6 | |
| Maximum | 11.3 | 11.3 | 14.1 | 16.2 | 21.2 | 27.4 | 24.0 | 25.2 | 25.9 | 18.4 | 12.3 | 12.4 | 27.4 | |
| 2024 | Average | 4.2 | 6.8 | 7.0 | 8.7 | 13.9 | 13.3 | 15.2 | 15.2 | 12.7 | 10.4 | 6.3 | 6.9 | 10.1 |
| Minimum | -8.6 | -1.5 | -1.6 | -1.1 | 6.8 | 3.8 | 7.0 | 7.5 | 1.3 | 0.0 | -6.9 | 0.0 | -8.6 | |
| Maximum | 11.6 | 13.0 | 13.9 | 18.4 | 23.9 | 25.0 | 24.9 | 23.0 | 23.2 | 15.7 | 13.8 | 12.5 | 25.0 | |
| 2025 | Average | 2.6 | 4.6 | 7.5 | 10.1 | 12.4 | 15.3 | 16.4 | 16.0 | 10.4 | 10.6 | 7.4 | 6.7 | 9.8 |
| Minimum | -8.0 | -3.2 | -2.4 | 0.0 | 0.4 | 5.3 | 7.6 | 6.9 | 2.3 | 2.3 | -3.6 | -2.6 | -8.0 | |
| Maximum | 9.7 | 13.7 | 18.6 | 23.4 | 23.6 | 26.2 | 26.3 | 29.2 | 16.9 | 16.3 | 15.5 | 14.1 | 29.2 | |
| 2026 | Average | 3.7 | 5.7 | 7.1 | 9.4 | 13.7 | so far 8.3 | |||||||
| Minimum | -7.1 | -2.7 | 0.0 | 0.0 | 3.1 | so far -7.1 | ||||||||
| Maximum | 9.2 | 13.5 | 15.5 | 20.1 | 28.6 | so far 28.6 |
Data Download
Data may be download in Excel format spreadsheets below. If you don't have Excel, you can open the files using LibreOffice.
These files are licensed under a Creative Commons Attribution-NonCommercial 4.0 International License .
Met Office Forecasts
The UK Met Office produce both a local and mountain weather forecast, please check the mountain weather forecast if going to the top of Malham Cove or on to Malham Moor.
15 Day Forecast From ECMWF
Meteogram forecast retrieved from ecmwf.int, this is not generated from the local weather station.
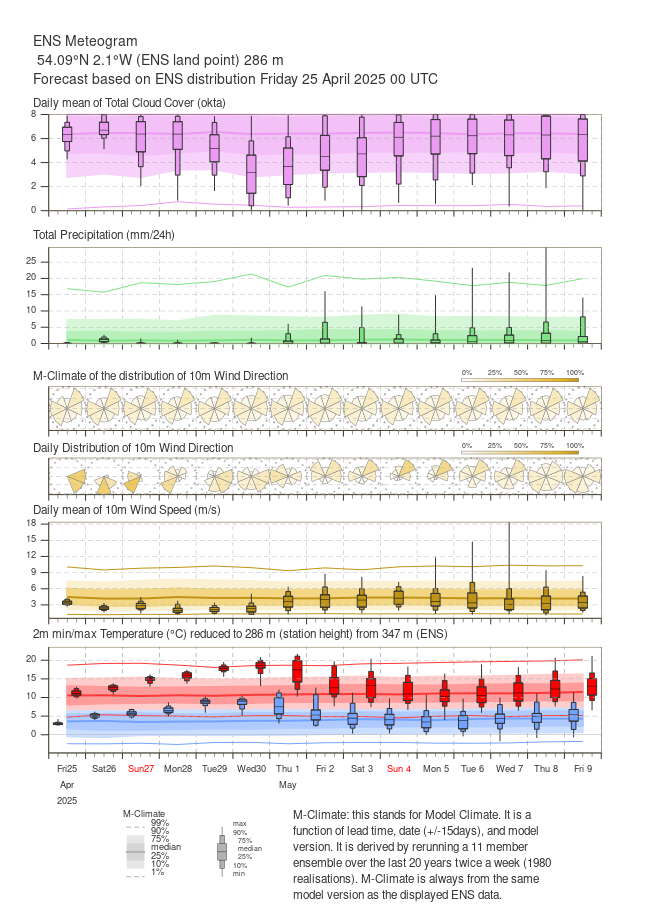
© 2021 European Centre for Medium-Range Weather Forecasts (ECMWF).
This data is published under a Creative Commons Attribution 4.0 International License (CC BY 4.0).
ECMWF does not accept any liability whatsoever for any error or omission in the data, their availability, or for any loss or damage arising from their use.